Recently, Milwaukee Public Schools (MPS) proposed a $252 million annual referendum that will raise taxes on those in the city in perpetuity. The question will be put to voters on the April 2 ballot. The district claims that, without the passage of the referendum, a 13% cut in schools and a 26% cut in central office administration will be required. Yet the district lacks a clear plan for how the increased spending will be put to work to improve student outcomes.
With nearly 70,000 students, MPS is by far the largest school district in the state. It is also a district where proficiency rates have been abysmal for decades. As such, this referendum request deserves a certain level of scrutiny. In this policy brief, WILL examines a number of different aspects of current spending in MPS to determine if this request for additional funding is truly warranted.
The Effect on Your Taxes
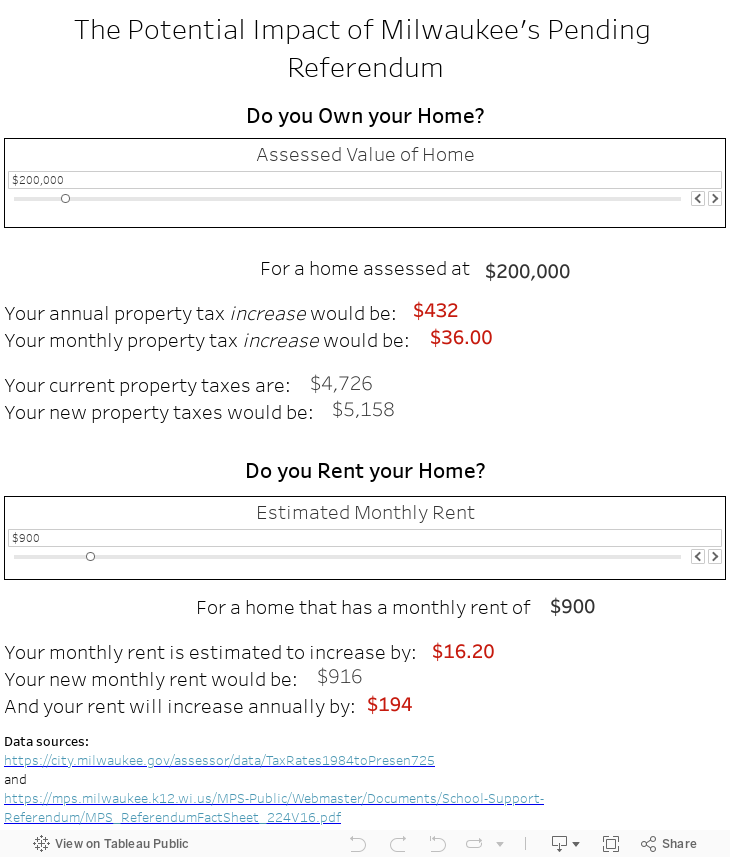
It is no secret that Milwaukee has struggled with low housing supply levels that have led to increasingly unaffordable housing. It’s clear that increasing property taxes is going to make it harder for families in Milwaukee to afford a home. The referendum, if passed, would increase property taxes by nearly 30%. For the first year after the referendum, for instance, a single-family home in Milwaukee with a median assessed value (i.e., of about $145,000) would see its property taxes increase by about $310.
The impact this would have on homes of differently assessed values can be seen with WILL’s interactive tool, which calculates, given a Milwaukee home’s assessed value, the per-month and per-year dollar values of the threatened property tax hike. Of course, it isn’t just home owners who will see their costs increase. Those in the city who pay rent will likely see increases as well as landlords pass on the cost to tenants. The tool also allows for you to calculate your rent increase. Note that this only directly applies to single-family home tenants, as rent shift in apartment buildings is more difficult to assess. Here, we assume that rental costs should be approximately 1% of a home’s value.
Is MPS being Shortchanged?
Media coverage about the proposed referendum have included claims that spending authority in Wisconsin and Milwaukee Public Schools has not kept up with inflation. Oftentimes, the basis for these claims centers around restoring funding levels to 2009-10 levels. For example, in a recent report released on his website, State Senator Chris Larson includes this policy goal: “Long-term, we need to thaw out from the freeze and make schools whole by setting revenue limits to inflation-adjusted 2009 levels. Then, every budget afterward, continue to index it to inflation” (emphasis original).
There is a reason this time frame was chosen for comparison: it represents a period of spending in Wisconsin schools that is out-of-step with long term trends. Figure 1 shows inflation-adjusted spending over time in Milwaukee since 2004—the earliest data available on the DPI website. Note that this chart does not include COVID-era ESSER funding (more on that below). In general, spending in the district has gone up over time. There was a spike in spending, however, in 2009 and 2010. This coincides with a massive infusion of funding from the federal government during the Great Recession, and a policy from Governor Doyle of raiding funding to pay for other state expenses. The federal funding eventually dried up, and the policy of raiding other sources was fiscally unsustainable in the long term. Inevitably, funding declined in the aftermath.

As noted above, this does not even include the huge amount of federal money made available to MPS during the pandemic. Between three rounds of COVID aid, MPS received more than $730 million in additional funding that must be spent between the 2020-21 and 2023-24 school years. While some of the funding has not yet been spent, as detailed in reports from the Institute for Reforming Government, here we divide that funding evenly across the three school years during which it could be spent—adding a total of $3,522 per student per year using current enrollment. This is represented in Figure 2.

If this funding is included, it takes Milwaukee beyond the record-high inflation adjusted spending of 2010-11. And while there are some strings attached to this funding, the inability of MPS to quickly allocate all of it once again calls into question the need for even more funding from local taxpayers.
Any way you slice it, MPS has more per student today than they did in 2004, and the most it ever has had if you include ESSER funds. The decline after 2010 was also coupled with the passage of Act 10, which—through pension and structural salary reforms—has allowed Wisconsin school districts to save billions. A forthcoming WILL report estimates the inflation-adjusted savings for MPS from healthcare and pension reforms at $96 million annually.
High Salaries in the Central Office
While the salaries of Central Office staff are a relatively small portion of the overall budget, it is worth highlighting the high salaries of these employees that have little or no regular interaction with students. The Department of Public Instruction provides a Public All Staff Report that details the position and salary information for every district in the state. The file lists 52 Central Office employees in MPS. The average pay of these employees is $123,116, with fringe benefits of $28,114. Forty-three of these employees have salaries of more than $100,000. The top five salaries are listed in Table 1, along with their position title.

Figure 3 shows the growth of salaries for teachers and administrators since the 2018-2019 school year. While the salaries appear to rise around the same rate, there remains a sizeable gap between the two.

MPS also has far more central office administrator positions than any other district in the state with 52. Only 35 of 422 districts have any listed in these positions at all. Of the districts that do have people in this capacity, the districts with the second-most such employees—Racine and Janesville—have 9. Of course, district enrollment matters when making these comparisons. Table 2 shows the ten districts with the most central officer administrators, along with a column for the number of such employees per 1,000 students. MPS is not at the top of this list, but still has a substantial number of administrators even given its student population.

This section thus looks at only one category of staffing, but there are many other MPS employees who don’t work directly with students on a regular basis. In the previously referenced DPI staffing file, there is a column that includes whether the employee is assigned to work in a school building or district wide. The remaining positions include therapists, athletic directors, occupational therapists, and program supervisors. After removing substitute teachers from that list, Table 3 shows the top ten districts with the most such employees in the state.
Once again, MPS rises to the top with the highest number of employees. After accounting for enrollment, MPS is still the third highest behind Greenfield and Racine among the ten districts. There is one non-school-based employee for approximately every 42 MPS students.

For years, declining enrollment has left MPS with more and more empty space in buildings that they own. A 2015 law mandated that MPS make these buildings available to private choice and charter schools, but the school system dragged their feet in allowing this to happen. That said, over time more buildings have been sold off—albeit primarily to developers.
The Milwaukee Public Schools Building Inventory Report mandated by the legislature allows us to examine to what degree MPS is actually using its buildings. The most recent report, submitted to the legislature for 2023, cannot be fully utilized because it is missing data and incomplete (it looks to be a scanned photocopy where some of the data is cut off). Despite requests to MPS several months ago for a clean copy, we have not received one. Consequently, the numbers below come from the 2022 report with supplementary information from the 2023 report where available.
According to the 2022 report, MPS sits at about 75% occupancy across all its buildings. While some buildings are over capacity, many are severely underutilized. The ten schools with the lowest percentage of utilization are detailed in Table 4. Three other buildings (Carlton, Edison, and Phillip) are listed as vacant.

Many of the lowest utilization buildings have “COVID Social Distancing” listed as an explanation for their underutilization on the 2022 report, but this is changed to “Overflow” space on the 2023 report. It would be interesting to learn from MPS the extent to which these schools are actually being utilized in this manner, or whether this is an excuse for holding on to excess buildings.
Many of these buildings also have substantial deferred maintenance that would make them difficult to fully utilize even if there were sufficient enrollment increases to justify it. Among buildings being utilized at less than 60% capacity, MPS estimates $69,147,578 of deferred maintenance. Table 5 lists the top ten schools below 60% capacity with the greatest amount of deferred maintenance.

The reality is that demographics coupled with continual low performance make it very unlikely that the district will see a significant increase in enrollment in the near future. Taxpayers ought to ask MPS why they continue to hold on to so many buildings given current enrollment trends in the city.
Questionable Spending Priorities
Given the urgency and the size of MPS’ request for still more taxpayer money, there are a number of categories of existing spending of theirs that taxpayers ought to question. Table 6 lists a few of these questionable categories of expenditure that we will describe in more detail below.

The budget for Communications is over $3 million. While it is important that a school district have the ability to communicate with families about enrollment dates, school closures and the like, it is hard to believe that millions must be spent in this capacity, particularly in an era where most information can be disseminated to parents via social media.
MPS’ budget also includes several different line items for types of “Advertising,” which add up to nearly $2 million overall. Some of these line items (nearly $200,000) address staff recruitment, which seems like a justifiable expense. Others are more doubtful; some $445,000 of advertising money was spent on “Information,” and more than half a million was spent on “OTH CM SV,” presumably the (still vague) “other community services.” As the home of school choice, some level of spending may be justifiable as the district competes for students with private choice and charter schools. But $2 million is a substantial line item for a district that professes to be in a tough financial position.
The district also plans to spend over $1 million over the next two years on their Department of Equity, Access, and Inclusion. The Department website describes their role as “provid[ing] districtwide professional development related to restorative practices, PBIS, and culturally and linguistically responsive practices” and “support[ing] and provide professional development to staff facilitating ethnic studies and restorative practices courses.”
PBIS, or Positive Behavior Intervention Supports, replaces traditional discipline with “restorative justice” practices. Previous WILL research on this practice has found that it does more harm than good, as misbehaving students have little incentive to improve their behavior. We found that Milwaukee schools that have implemented PBIS have lower English proficiency than schools that did not use these techniques. Taxpayers should question whether continuing to support PBIS is a good use of current funds.
Milwaukee’s Education Record
Perhaps this spending increase could be justified if MPS had a positive track record of success. But the reality is the opposite. MPS has failed generations of students to such an extent that it led to the creation of the nation’s first ever school choice program to offer desperate families a way out in 1990, and things have not improved since. Figure 4 shows proficiency on the Forward Exam’s English/Language Arts (ELA) component since 2015.

There was no data for 2019 due to the lack of proficiency testing amidst the coronavirus pandemic.
The high watermark for proficiency is 2016—where proficiency reached 20.4%. But note that this means that nearly 80% of students in the district were not meeting state proficiency standards. Proficiency reached its nadir in the first year of testing post COVID (note the skipped year in the chart). But it has not fully rebounded since, and remains below the dreadful levels observed before the year of school shutdowns.
Voters already approved a recurring referendum in 2020 that will raise taxes by $87 million annually into perpetuity. The revenue from the 2020 referendum was not prioritized to improve student achievement, but rather spent hiring staff to expand their music, art, and physical education programming, and support for student mental health and well-being. While these are important, the current referendum proposal of $252 million annually is almost 190% more than the one four years ago. MPS has offered no concrete plans on how the money will be spent to improve student outcomes beyond saying this will keep programming funded at their current level. This is an exorbitant amount of money to ask for with no guarantee that it will be efficiently used to address the biggest educational problems facing the district, some of the worst math and reading proficiency for large school districts in the nation.
Referendum Increases the Disparity Between Public Schools & Choice/Charter Schools
Milwaukee, as home to some of the first school choice programs in the country, has provided decades of evidence that private school choice and charter schools can get better results with less expenditure on the part of taxpayers. Our recent Apples to Apples report showed that ELA proficiency gains per $1,000 spent were 1.8% in the choice program and 0.53% higher in independent charters. Yet despite positive outcomes, these schools struggle to compete with public schools that can offer significantly higher pay and benefits.
In 2023, the Legislature and Governor Evers came together to pass legislation that closed the funding gap between choice, charter, and public schools. While a funding gap still exists in favor of public schools, the size of the gap has closed considerably.
Figure 5 shows inflation-adjusted funding in MPS versus choice and independent charter schools. Only state and local funding is included here because it is difficult to make a determination of exactly how much federal money makes it to choice schools—but the figures almost certainly minimize the gap. Note that the 2024 MPS number is an estimate based on how spending in the district has changed over the past decade, while the choice and charter numbers are already in state law.

Closing the gap even to the extent that it has been closed took the expenditure of a lot of political capital and bipartisanship that is uncommon in Madison today. But this referendum mutes the effect of all that work by once again expanding the public-school funding advantage. Private choice and charter schools are a vital part of the education landscape of a city that struggles mightily to educate children from disadvantaged backgrounds. This referendum could widen the funding gap between choice and charter schools doing those students great harm.


Miranda Spindt
Policy Associate

Noah Diekemper
Senior Research Analyst