
Student loan forgiveness has been a major topic of debate in the United States in recent years. While many students face crippling debt, taxpayers argue that this debt is not the responsibility of those who did not take out the loans. Meanwhile, the college and universities that have encouraged students to take on this debt are largely ignored, creating another generation of heavily indebted students.

Research & Analysis
FROM THE TOP: The Impact of College-Level Indoctrination on K-12 Education
April 2023 | Will Flanders, PhD & Dylan Palmer
For this report, we collected syllabi from courses for education majors at all of the University of Wisconsin’s four-year public colleges. In 2020, the University of Wisconsin System graduated approximately 2,000 students majoring in various education programs.4 While we cannot gather data from private universities in the state via open records requests, we can safely say that the schools from which we have gathered data represents courses taken by roughly 80% of all education graduates in the state for recent years.

From Coast to Coast: A 50 State Review of Technical College Funding
April 2023 | Will Flanders, PhD & Miranda Sprindt
America was founded on the principle of no taxation without representation, and unfortunately Wisconsin’s technical college system fails to live up to that principle. Wisconsin’s overall property tax burden is high compared to other states, ranking 8th highest in the nation in 2021. In past state budgets, policymakers have increased aid to technical colleges in return for reductions in property taxes. Removing technical colleges from the property tax rolls over time would help lower Wisconsin’s overall tax burden, making Wisconsin more competitive.

Bang for the Buck-y: How to Direct College Students Towards Degrees that Will Improve Wisconsin’s Workforce
December 2022 | Will Flanders, PhD & Cori Petersen
In this paper, we turn the focus back on universities. We make the case that public universities must serve as good stewards of taxpayer money, and those that are putting students on career paths where they’re unlikely to be able to pay their student loans ought to be held accountable. Moreover, universities should aid in solving the growing workforce crisis by steering students towards careers where there are shortages in the state. Using extensive data on college defaults and the return-on-investment from various degrees, we highlight the schools and programs that are a net positive for would-be college students, and those that are not.
Note: An earlier version of this report was missing a row in table 1, leading to incorrect default rates for the listed schools. This has been corrected.

2020 Wisconsin Speech Code Review
April 2020 | Rick Esenberg, Legal Team
A review of speech codes at Wisconsin colleges and universities by the Wisconsin Institute for Law & Liberty (WILL) found that more than half of institutions reviewed substantially restrict freedom of speech. Three quarters of Wisconsin’s technical colleges and one third of the four-year colleges in the University of Wisconsin system have policies that severely restrict free speech. WILL could not identify one college or university that had no policies that restrict or threaten free speech.
Tableaus
Below are five tableaus that depict various conceptions of the lifetime Return on Investment (ROI) at Wisconsin colleges and universities. The results adopted from a national study by the Foundation for Research on Equal Opportunity. In simplest terms, this measures the lifetime earnings benefit of the degree in question minus the costs of earning the degree and forgone earnings while in school. For details, check out this link: https://freopp.org/is-college-worth-it-a-comprehensive-return-on-investment-analysis-1b2ad17f84c8.
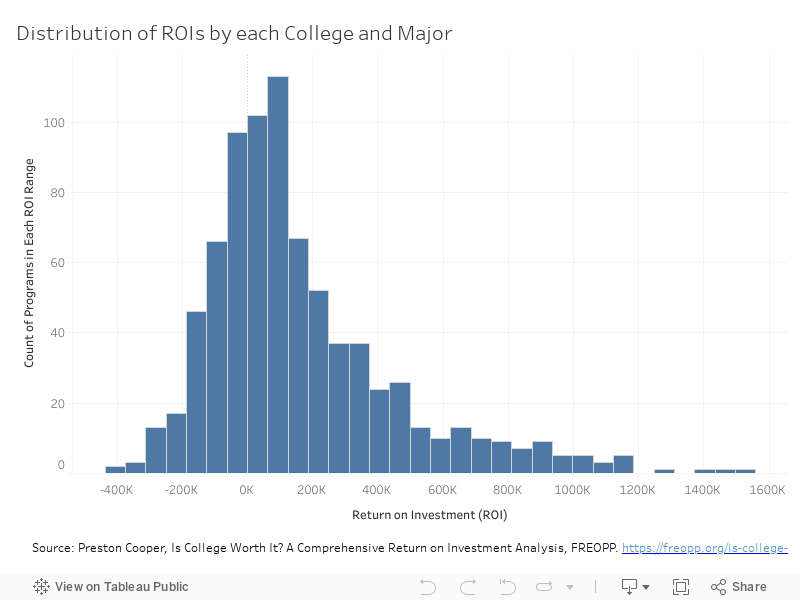
The Histogram of All Lifetime ROIs
The following graph shows the average return on investment (ROI) for degrees in different majors at different colleges across Wisconsin. For each major at each college, an average ROI was found; this graph plots how many college-major programs ROIs fall into different buckets. So at the upper end of the distribution, there is one program (UW-Madison’s Real Estate degree) that averages an ROI of more than $1.5 million. On the other hand, a plurality of programs (113) have a ROI that falls somewhere between $62,000 and $125,000. Mouse over each bar to see how many programs fall in each category.
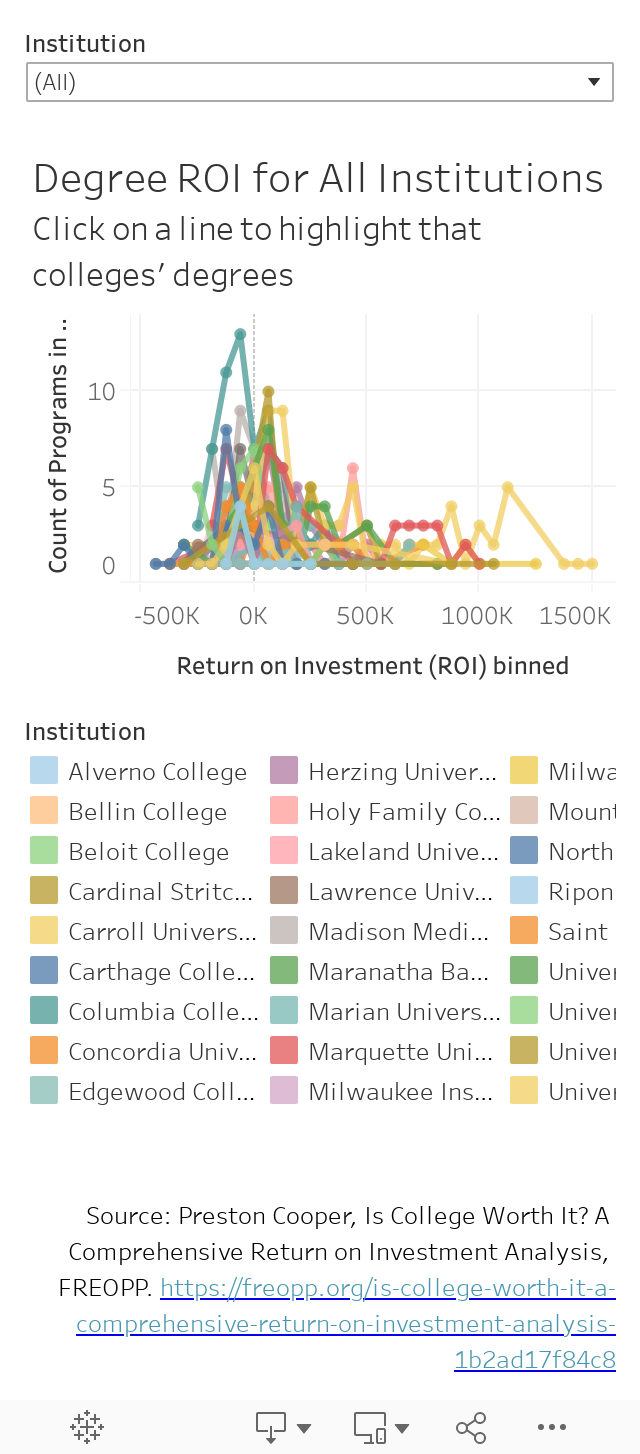
This graph shows the same information as the previous one—plotting how many college-major programs fall into each ROI bracket—except that the information is separated out by college. Each college is its own line with a color, and each bold dot on the line is a count of how many degrees have that ROI. So for example, UW-Platteville has 6 different majors that have an average ROI between $436,000 and $500,000, but it only offers one major (“Electrical, Electronics and Communications Engineering”) with an average ROI above $623,000. Click on any line to highlight just that one, and mouse over bold dots for more information.
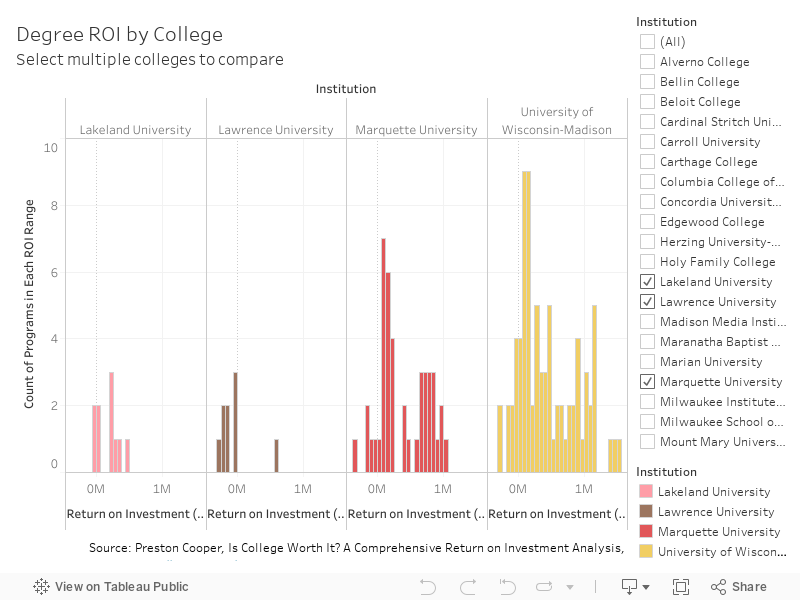
These bar graphs let you compare the average ROIs for each university’s major programs. Check the boxes at the right for the universities you want to compare and you will see bar graphs, similar to those above, that stack higher when more major programs fall into each ROI bracket. Mouse over individual bars to see more details.
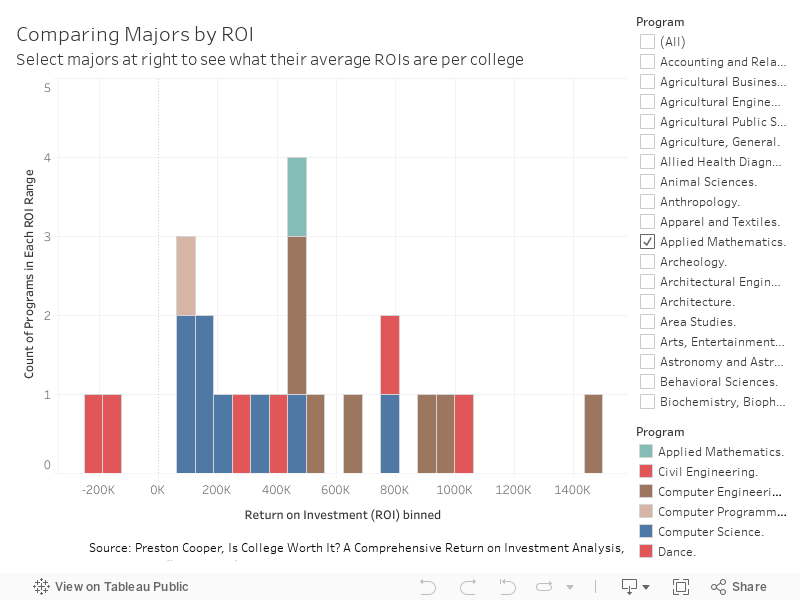
This bar graph lets you compare different major programs’ ROIs. On the list at the right, check off the boxes next to the majors you want to compare, and those majors will appear color-coded (legend at bottom right) on the plot, with higher bars for more instances appearing in that ROI’s bracket. This lets you compare the distribution of ROIs for different majors, e.g., where “Computer Engineering” ROIs cluster compared to those of “Philosophy.” It also lets you examine a given major and see which institutions yield higher average ROIs for that type of program, e.g. UW-Madison’s Computer Engineering ROI is almost three times UW-Platteville’s ROI for the same program. Mouse over bars for more details.
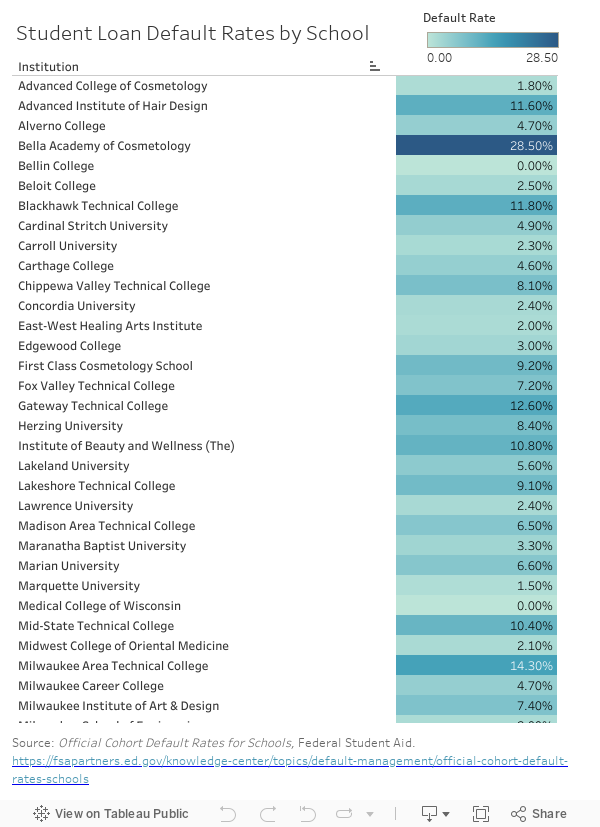
This table shows the rates at which student who attended each college go into default. The darker the shading on the percentage, the higher the loan default rate is. The rows are listed alphabetically by college, although they can be ranked by default rate by mousing over the heading of “Institution,” clicking the triangle that appears at the right, and selecting the variable listed beside “Field.” This matters because higher default rates are indicative of either students not finishing the program or entering careers that don’t pay well enough to pay off their loans.
Graphics
Below are sample information graphics, displaying the outcomes for students who have chosen specific majors at certain universities.

Example Infographic: UW-Stout Graphic Design Degree
Cori Petersen
December 2022

Example Infographic: UW-EC Business Management Degree
Cori Petersen
December 2022

Example Infographic: UW-EC Marketing Degree
Cori Petersen
December 2022