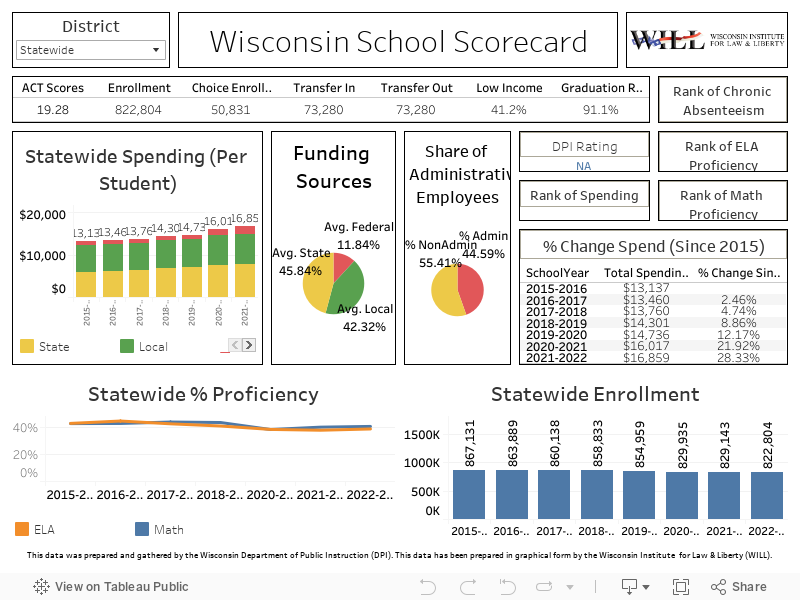
This website provides a ‘one-stop-shop’ for information about Wisconsin’s PUBLIC schools. Here, you can view trends in enrollment, proficiency, and a host of other information.
Definitions for Key Terms and an FAQ are provided at the bottom of the page. Please use the district dropdown on the TOP LEFT to select the school district from the menu to view. This information is also available to download. Please select from the menu at the BOTTOM of the informational screen and select either image or PDF.
For more information, contact: [email protected]
***The data in the scorecard was last updated on April 1, 2024.***
KEY TERMS
ACT Score
This is the average composite score in the district for students who took the ACT. The highest possible score is 36.0. With few exceptions, high school juniors in Wisconsin are required to take the ACT. This does not include the ACT Aspire results. Original data can be found here.
Choice Enrollment
The number of students in the district who participate in one of the state’s parental choice programs. Choice enrollment is attributed to the district where the choice school is located. Original data can be found here.
Chronic Absenteeism
A student is considered chronically absent if they miss more than 10% of the schooldays possible, and have been enrolled for more than 90 days. Lower numbers in our ranking are indicative of lower rates of chronic absenteeism. Original data can be found here.
District Proficiency
There are several levels of proficiency in DPI’s data. A child is considered proficient in a subject if they score “proficient” or “advanced” on the state’s Forward exam. A child is considered not proficient if they score “basic” and “below basic” in the subject on the Forward exam. Students who did not take the test are included as “Not Proficient” in the same manner that DPI reports the results. Additional information on how these categories are created is found here. Original data can be found within the report cards here.
DPI Report Card Rating
The categorical grade assigned to the district from DPI on a five-point scale with the categories: “Fails to Meet Expectations,” “Meets Few Expectations,” “Meets Expectations,” “Exceeds Expectations,” and “Significantly Exceeds Expectations.” Original data can be found here.
Enrollment
The number of students enrolled in the district in each school year. This number does not include students who use the public-school open enrollment program to attend the district. Original data can be found here.
Graduation Rate
The percentage of students in the district who complete High School within four years. This data is current for the 2022-23 school year. Original data can be found here.
Open Enrollment In
The number of students from other districts who used the state’s Open Enrollment Program to enroll into the district. Original data can be found here.
Open Enrollment Out
The number of students from the districts who used the state’s Open Enrollment Program to enroll into other districts in the state. Original data can be found here.
Percent Federal Aid
The percentage of overall revenue to the district that comes from the federal government. This money is often earmarked for certain purposes and generally cannot be used at the district’s discretion. This figure also does not include money districts received as part of any COVID relief packages (ESSER I, ESSER II). Original data can be found here.
Percent Local Aid
The percentage of overall revenue to the district that comes from the local sources—primarily property taxes, but also things like fees and interest earnings. Original data can be found here.
Percent Low Income
The percentage of students in a school district whose family earns less than 185% of the federal poverty limit. Original data can be found here.
Percent State Aid
The percentage of overall revenue to the district that comes from the state of Wisconsin. This includes funding streams such as students with disabilities, transportation aid and other state funding sources. Original data can be found here.
Reading Instruction Materials
Spending (per student)
School districts are funded through three sources: local aid, state aid and federal aid. The percent attributed to the sources is determined by the district’s revenue limit, set by law, district enrollment and tax base. Depending on the make-up of the district, the percentage of local funds and state funds varies by district. The original data can be found here.
FAQs
How can I see the state averages?
Listed in the drop down, there is a “statewide” option. This provides a general overview of the state data for 2021-2022.
Why is the ACT Scores Missing?
For K-8 only districts, the ACT exam is not taken by students younger than high school.
Why is Open Enrollment Data missing?
If there is no data generated, no student used the program.
Why is graduation rate missing?
For K-8 only districts, graduation rate does not apply for students younger than high school.
Why is there data missing for the district?
If a district was created or consolidated in the last five years, some data may be missing for the district (such as enrollment or student proficiency).
What year of data is this based on?
This data is based on the data published by DPI from 2021-2022 school year.
How do I download this data?
Using the menu at the bottom of the information, please select download. From there, you can select either an image or PDF document for the district.