Introduction
Recently, results from the National Assessment for Educational Progress (NAEP) have caused shockwaves around the country. At least partially-related to teachers’ union-led shutdowns that kept schools closed well past when it was reasonable to do so,[i] decades of progress in scores were erased over the course of three years.[ii]
Despite declining scores across the board, the Wisconsin Department of Public Instruction (DPI) attempted to paint a relatively rosy picture of the results for the state. Claiming that elementary students had “bucked the trend,” a DPI press release[iii] pointed to evidence that Wisconsin students still ranked above the national average. On the surface, this information appeared to be true—Wisconsin 4th graders tied for 18th in reading and 8th graders tied for 9th. But a look below the surface reveals that Wisconsin families should be far more concerned than these rankings suggest.
Among the key takeaways from the report include:
- Demographics matter in assessing NAEP performance. Unfortunately, student characteristics are correlated with student outcomes. States with fewer students in more challenging categories get a “free pass” when demographics aren’t accounted for.
- Wisconsin falls from a tie for 18th to 32nd in fourth grade reading when demographics are accounted for. When controlling for student race, income status, and disability rate Wisconsin drops 14 places.
- Wisconsin falls from a tie for 9th to 19th in eighth grade reading once demographics are accounted for. When controlling for student race, income status, and disability rate Wisconsin drops 10 places.
- States like Florida and Mississippi that have implemented significant education reform show positive results for student achievement. States that have implemented extensive school-choice programs and stringent reading requirements rank higher when fair comparisons are made.
Wisconsin Demographics & the Nation
Unfortunately, research has found that student demographics still play a significant role in educational achievement. For instance, the most recent edition of WILL’s Apples to Apples report[iv] found that students from low-income backgrounds had proficiency rates approximately 30% lower in English/Language Arts on average than students from wealthier families. Students from African American backgrounds also had proficiency rates 30% lower in reading. In order to fairly compare students on the NAEP, it is important to account for where each state stands on these demographic factors. Without this, we are largely measuring which states are wealthier, less diverse, and have fewer low-income students.
The table below shows where Wisconsin ranks on the number of non-white, disabled, and low-income students relative to the rest of the nation and D.C. using data from the 2020-21 Digest of Education Statistics.[v] Note that low-income status is measured here with the percentage of students eligible for Free and Reduced Lunch. Higher rankings indicate fewer students in each category.
Table 1. Wisconsin Demographic Ranking
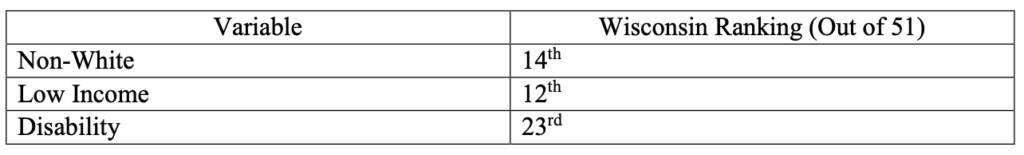
While Wisconsin ranks in the middle-of-the-pack in terms of the share of students with a disability, the state is on the low end of the spectrum when it comes to both the share of non-white students and the share of low-income students. Thus, failing to account for these factors when assessing NAEP performance likely makes Wisconsin look overly positive. In the following analysis, we account for these factors to identify where Wisconsin really ought to rank.
Methods
The analysis we conduct here is very similar to that which we have done in previous Apples to Apples[vi] reports to rank schools and districts. Using the three demographic variables mentioned above, we conduct a statistical analysis to estimate a predicted NAEP score for both 4th and 8th grade reading for each state. This estimate serves as a baseline for what a state would be expected to achieve given its demographics. We then subtract that prediction from the state’s actual score. If the result is positive, the state can be judged to be having a relatively positive effect on student performance. If the result is negative, the state can be judged to be having a relatively negative effect.
Results: Baseline
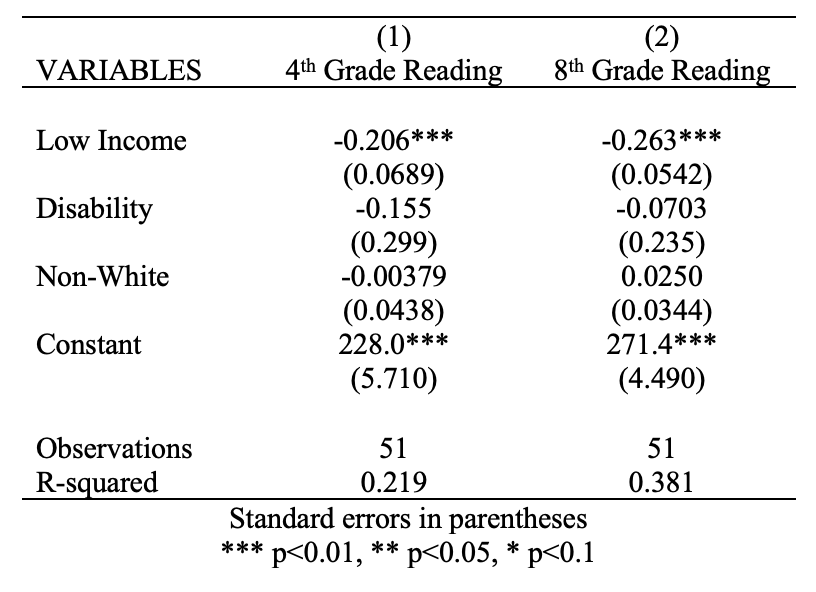
The table below provides the regression results that will be used to make the predictions for NAEP scores for each state. On the national level, the percentage of students who are low-income appears to be the largest driver of NAEP Reading performance. A 10% increase in the percentage of low-income students would be expected to result in a 2.06 point decline in NAEP reading scores for 4th grade, and a 2.63 point decline for 8th grade. The share of non-white students and income status is highly correlated. If income status were excluded from the analysis, the share non-white would become significant and negative.
Table 2. Correlates of NAEP Reading Scores
Results: Prediction Gap
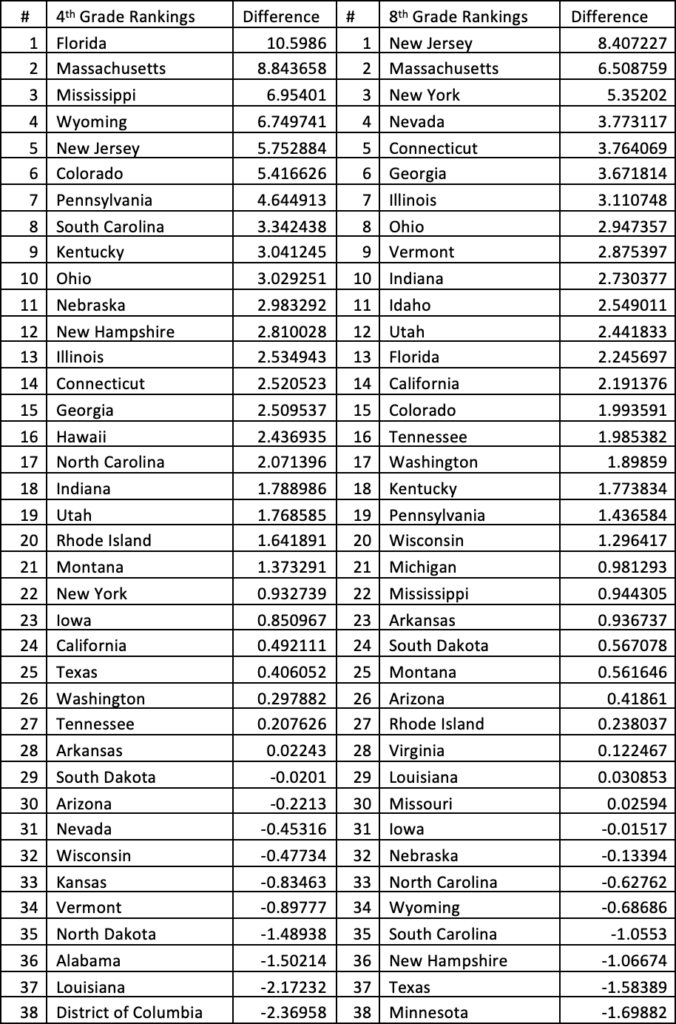
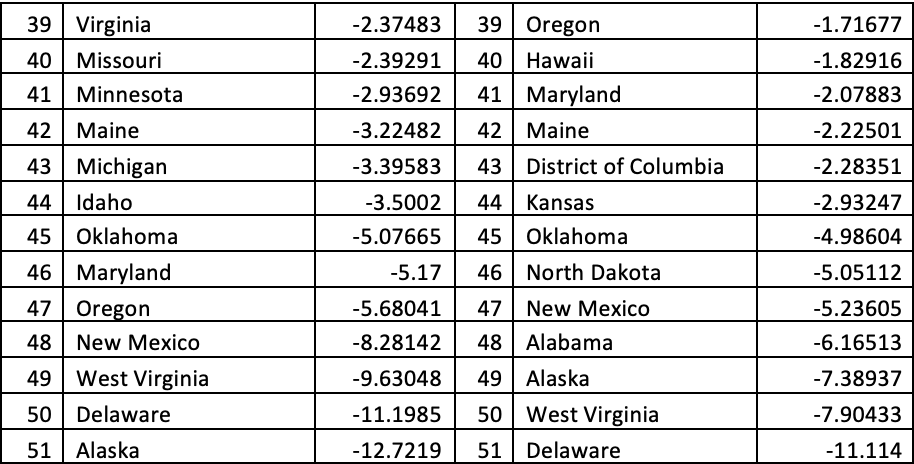
The table below presents the top ten and bottom ten states in terms of the prediction gap, along with Wisconsin’s placement for 4th grade performance. The full list will be included in an appendix.
Table 3. NAEP Predicted and Actual Performance Gap (4th Grade)
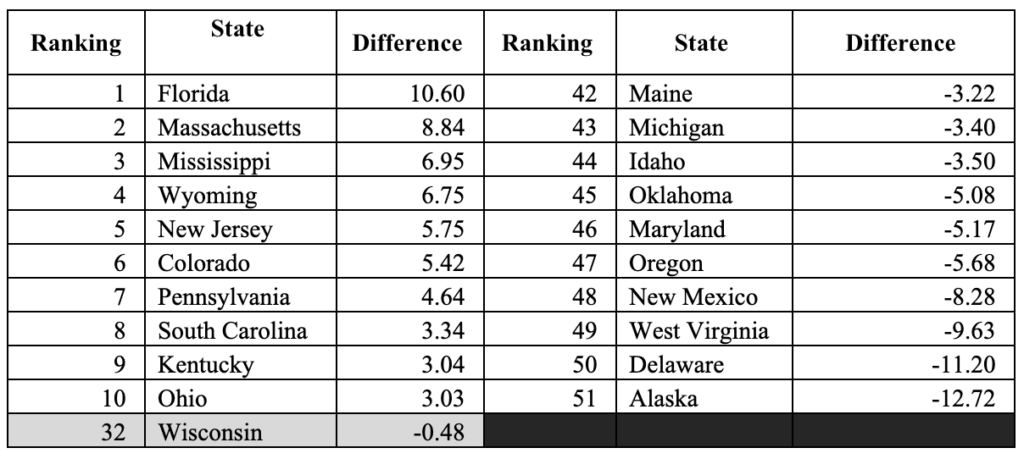
The states near the top here are illuminating. Since the era of Jeb Bush,[vii] Florida has been a state that has put a major focus on improving education on the public-school side while also embracing competition through school choice. This has continued with the expansion of educational options in recent years.[vii] While it cannot be said from this analysis that these policies deserve credit for the state’s ranking, it is certainly something to consider.
Also near the top is the state of Mississippi, which has put a significant emphasis on the science of reading in recent years. Among the key components of Mississippi’s reforms was a provision that required students to reach a certain level of proficiency before moving on to fourth grade. Reading before fourth grade is considered critical because experts say this is the time frame in which students transition from “learning to read to reading to learn.[viii]” Overall, the state has moved from 49th in reading proficiency to 29th since 2013.[ix] The results here are further evidence that such policies can be effective with challenging student populations. The results for Wisconsin are far less positive. The state falls from a tie for 18th to 32nd once demographic factors are considered. The negative sign here means that Wisconsin’s educational system is doing worse with its fourth graders than would be expected in reading given state demographics.
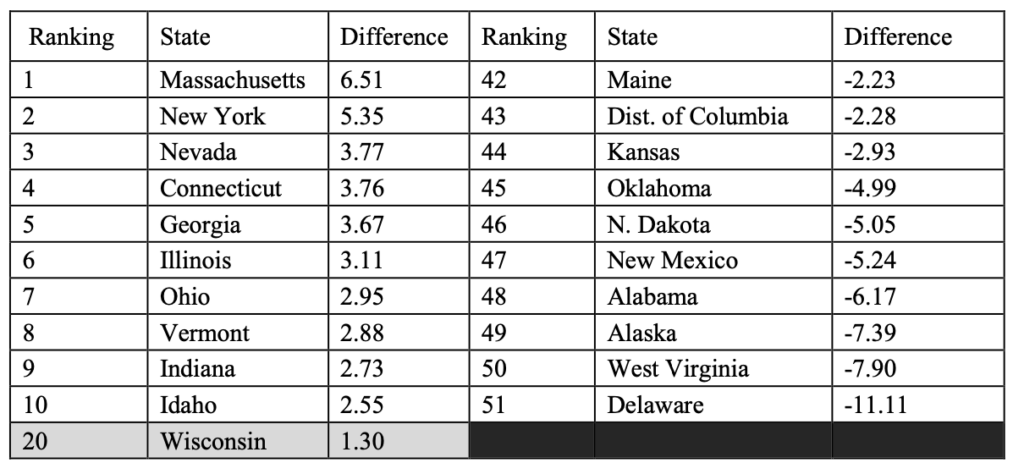
The results for 8th grade are presented in Table 4. There are, perhaps, fewer surprises here. The interventions in Mississippi that have taken hold in fourth grade recently have not yet made it to the eighth-grade level. But Wisconsin still takes a significant tumble from a tie for 9th to 19th under this metric. It should be noted that the state is still shown to have a relatively positive effect on NAEP scores here, but it is significantly smaller than in the unadjusted data.
Table 4. NAEP Predicted and Actual Performance Gap (8th Grade)
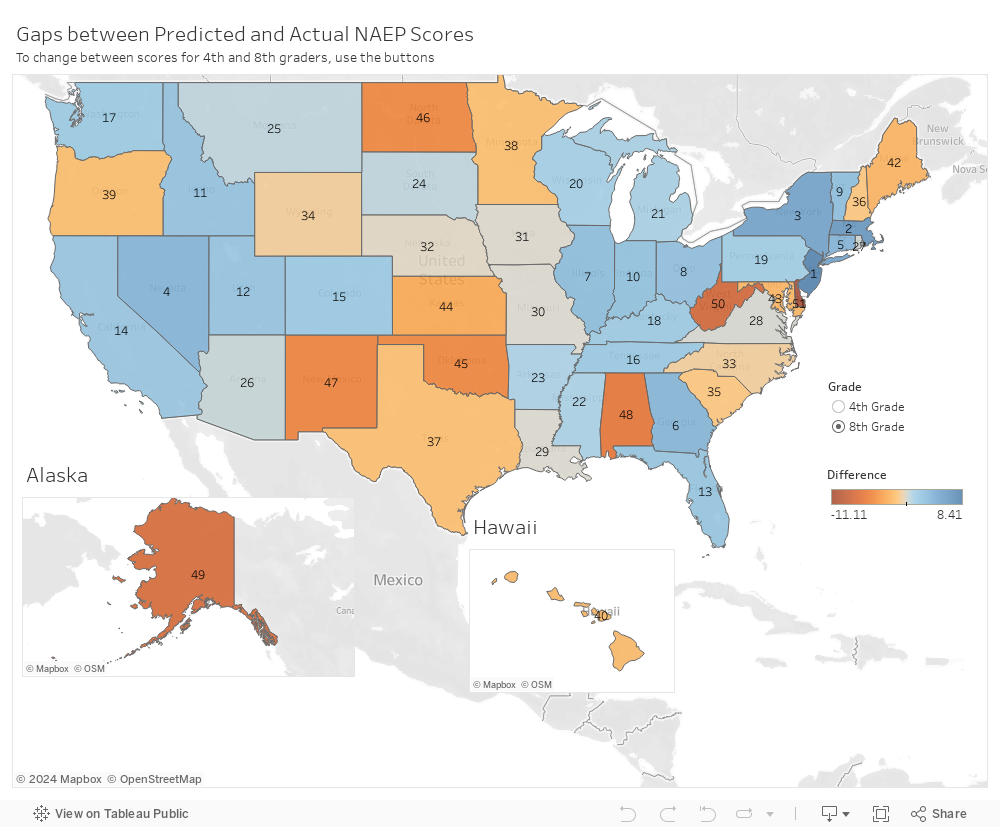
The figure below displays both the 4th and 8th grade results graphically.
Use the grade buttons located on the right side of the map to change the results between grades. Ranking is how the state scores after accounting for student demographics. Score gap is the difference between the NAEP scores and the actual performance of students when taking into account student demographics.
Conclusion
The focus of this policy brief was on reading, as this has been the subject of much interest among policymakers in Wisconsin in the past few years. It should be noted that a similar analysis of math yields slightly more positive results for the state. That said, the results for reading presented here show clearly that Wisconsin cannot afford to rely on its demographics to keep the state near the top in terms of education. While Wisconsin receives much deserved scrutiny for its persistent racial achievement gap, this analysis shows that problems are more widespread. Given the demographic characteristics of the state, Wisconsin should rank significantly higher on the NAEP than it does.
There are a number of policy solutions to this issue. The implementation of school choice for all families would guarantee that no student is left out in the cold when it comes to educational choices regardless of their ZIP code or family income. Such a proposal would also provide needed competition to the public-school sector, and encourage improvement. But proposals for the improvement of public schools must be considered as well. As mentioned earlier, the fact that the state of Mississippi rises nearly to the top in the gap between predicted and actual performance is yet another signal that reading reforms in the state have been effective. Policymakers in Wisconsin ought to give these options another examination in the next legislative session.
Appendix. Rankings of the 50 States and D.C.
Will Flanders, PhD
[i] reopening-brief.pdf (will-law.org)
[ii] 2022 NAEP Results Show Over 20 Years of Learning Progress Lost (1851franchise.com)
[iii] Wisconsin elementary school students buck national trends in ‘National Report Card’ release | Wisconsin Department of Public Instruction
[iv] ApplestoApplesII.pdf (will-law.org)
[v] Digest of Education Statistics Home
[vi] applestoapplesstudyiii-1.pdf (will-law.org)
[vii] Jeb Bush (excelined.org)
[viii] Why is Reading at Grade Level by 3rd Grade So Important? | Communications Center | Ball State University (bsu.edu)
[ix] Opinion | There Is a Right Way to Teach Reading, and Mississippi Knows It – The New York Times (nytimes.com)