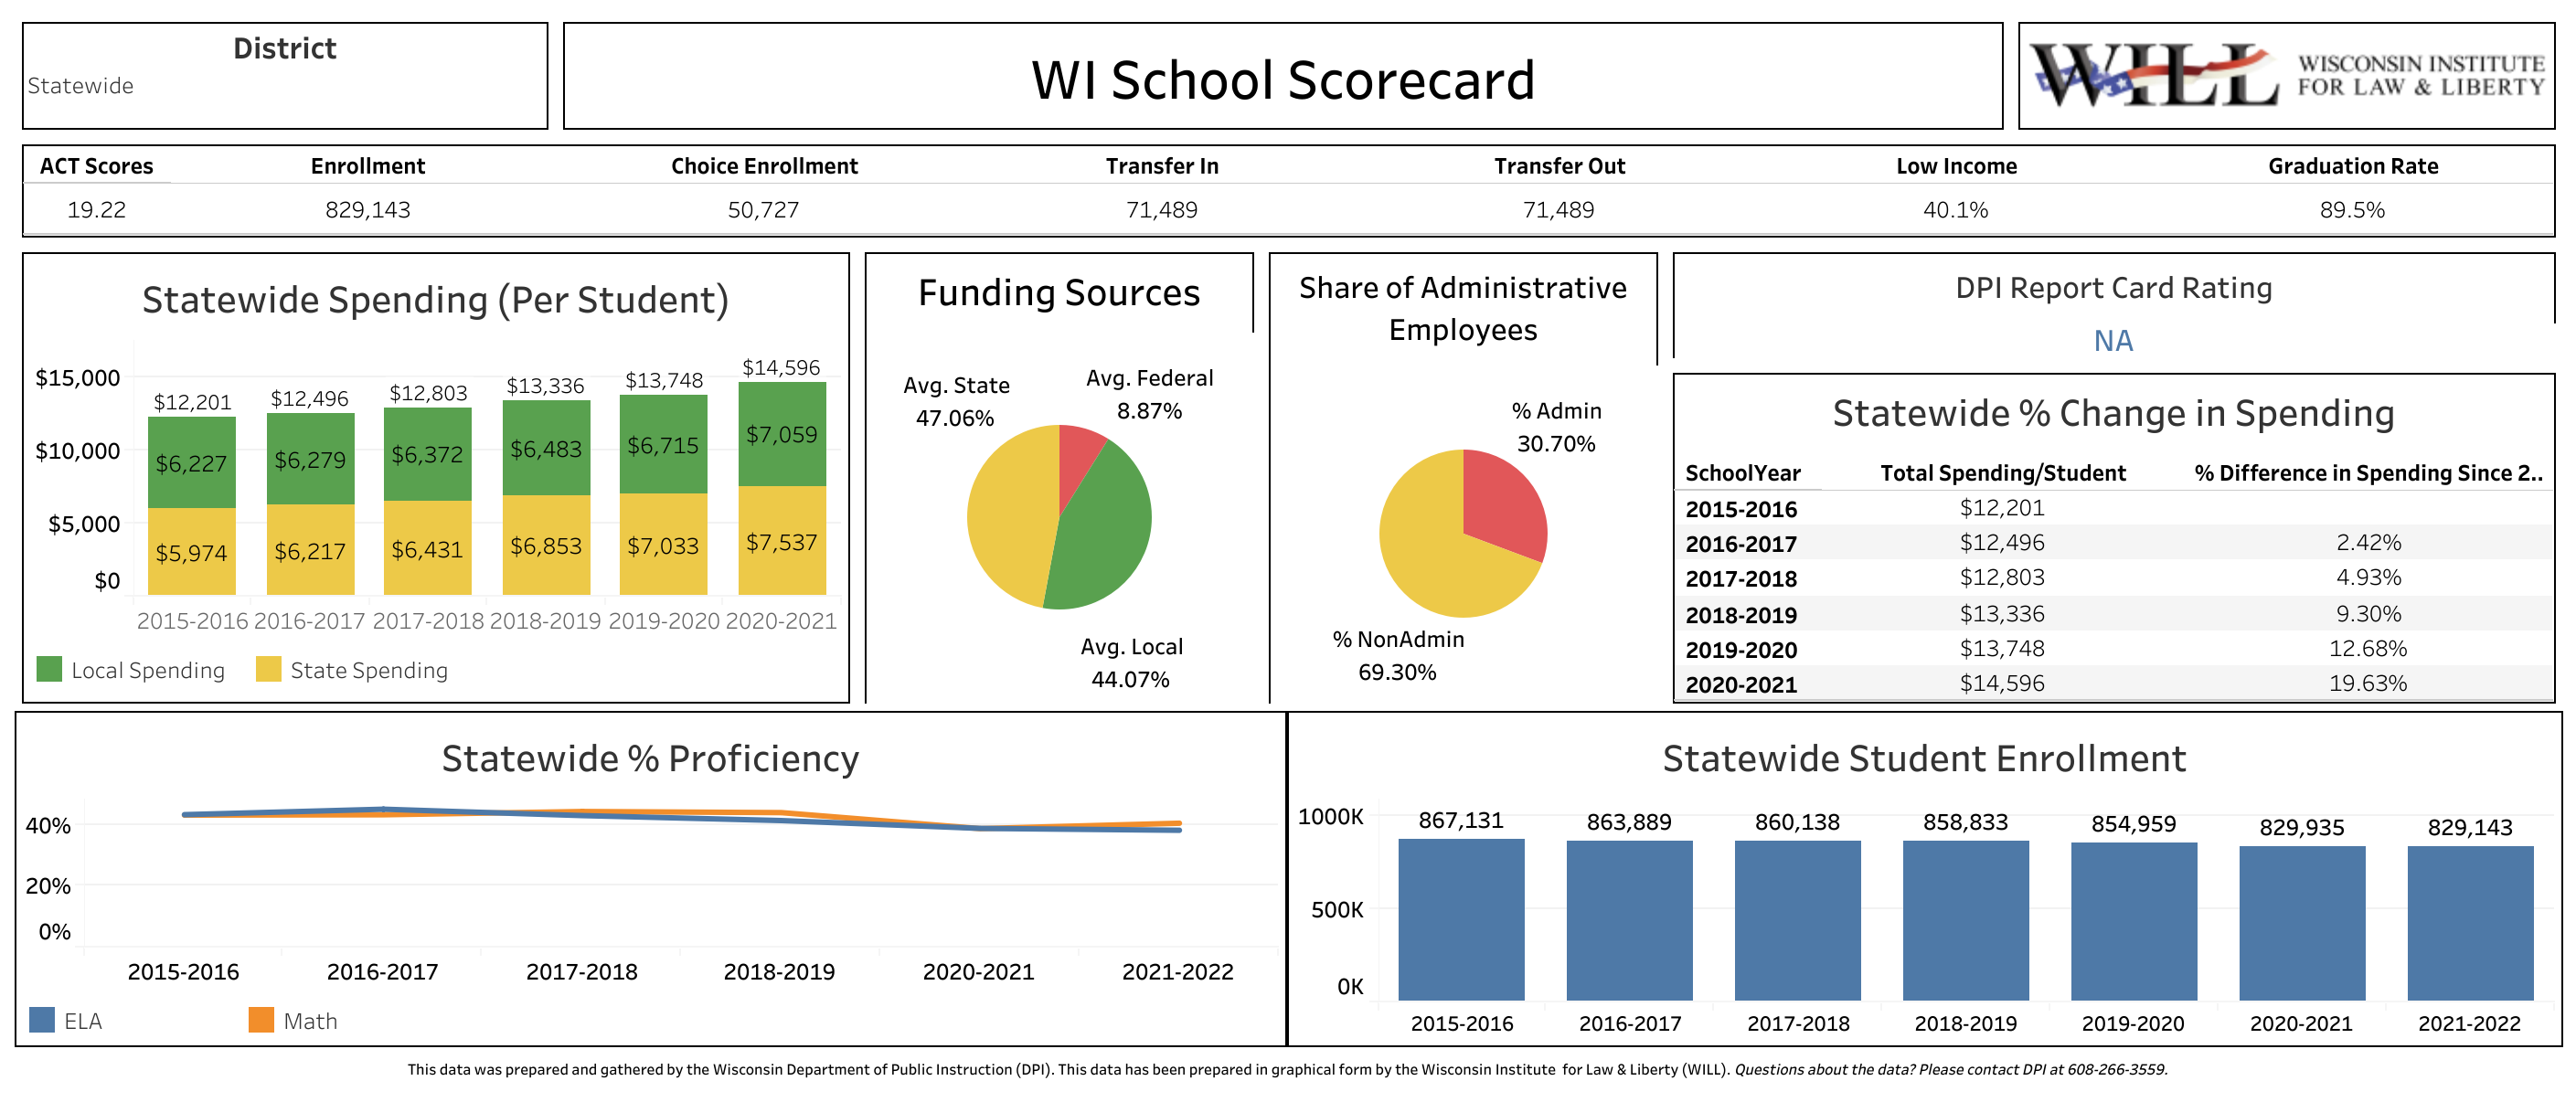
The News: The Wisconsin Institute for Law & Liberty (WILL) is excited to announce its update of the School Data Dashboard, which now includes data for the 2021-2022 academic year.
This comprehensive, interactive tool provides a snapshot of student proficiency, district funding and district-related information for every school district in the state– imported from DPI. This user-friendly resource now includes important data regarding administrative staffing levels, showing which districts are allocating resources to teachers in the classroom.
The Quotes: WILL Research Director, Will Flanders, PhD, stated “WILL is proud to continue to provide this resource for Wisconsin families. We believe that giving accurate, easy-to-access information about our school districts is critical to the future of education in Wisconsin.”
Scott Frostman, Community Christian School Baraboo Board member, former Baraboo School Board member, said, “WILL’s School Data Dashboard is a gamechanger for parents and others seeking more information about their district that is often very difficult to obtain through public resources. Having served on both a public and private choice school board, a tool like this would have been invaluable to myself and colleagues in evaluating our district performance, areas needing focus, and how we compared with neighboring communities.”
Amanda Nedweski, parent and State Representative of Wisconsin’s 61st Assembly District, said, “WILL’s School Data Dashboard is a great go-to resource for Wisconsin parents, school board members and policymakers. It is easy to use and provides critical information like student proficiency, spending per-pupil, and student enrollment in one snapshot. This year WILL has added a new feature that shows what percentage of district staff is administrative vs. non-administrative staff. It is truly a one-stop-shop tool for often hard to find information.”
Background: Last year, WILL developed and released the School Data Dashboard as a one-stop-shop for all to view Wisconsin school districts’ trends in enrollment, proficiency, and the like.
This year, new data on administrative staffing levels were added to the dashboard. The graph below gives context on money spent for bureaucracy rather than in classrooms.

Check it out by clicking on the image below or going to KnowMySchoolWI.com. Be sure to tell us what you think!

