Miranda Spindt
Will Flanders
In May, RAND released the fifth iteration of their hospital price study which ranked Wisconsin as having the 5th highest hospital prices, and the most expensive professional fees in the nation. The RAND report is an important tool for employers to better understand their costs and make the best financial decisions possible for their employees’ health coverage. It also highlights the importance of strengthening healthcare price transparency in Wisconsin, a measure that would empower patients to make the best healthcare decisions for them, ultimately increasing competition and reducing healthcare costs in the state.
However, the Wisconsin Hospital Association (WHA) immediately took issue with the study as they have with the previous versions due to its “inherently flawed methodology and skewed data.” But do these claims hold water? While this and every study has flaws and limitations, their claims are an over exaggeration at best, and an attempt to undermine the importance of price transparency at worst. Let’s dive into their claims.
Sample Size
The WHA claims that the sample size used by the study is “extremely small” and “cherry-picked” accounting for just 275,000 of the 21 million outpatient visits (1.3%) and 13,000 out of 464,000 inpatient visits (2.7%) in the state. While these are small percentages, a good sample size is not based on what percent of the population is used. Rather, there is a formula to find the minimum sample size that is representative of the population based on desired factors such as the confidence level and margin of error. We see this in polling methodology, where a sample of just over 1,100 respondents can represent the entire US population with a margin of error of about 3%.
Using that formula, we see that RAND’s sample sizes for both populations are actually pretty robust. RAND only needed a sample of 1,065 for both the inpatient and outpatient populations, or 0.005% and 0.23% respectively. This is with a 95% confidence interval and 3% margin of error. Additional context further shows the strength of the data. Their sample size included 65% of hospitals and ambulatory care centers nationally, and 4.5% of national commercial hospital spending.
Finally, the WHA also highlights an example of just one Wisconsin hospital that has great variation in price across three versions of the study. It was 290% of the Medicare rate in 2020, 185% in 2022, and 338% in 2024. Variation like this should be looked at critically for individual hospitals, but this is not reflective of broad issues in the study. The consistency between two rounds of RAND ranking Wisconsin 4th highest in 2022 and 5th in 2024 suggests that random variation like this is not significantly affecting the overall findings.
Medicare
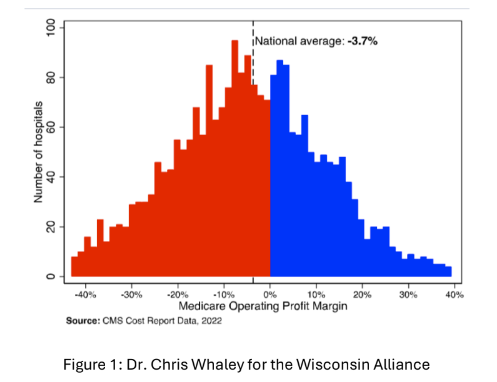
The WHA also takes issue with RAND using Medicare reimbursement rates as a benchmark to compare hospital prices across states claiming that it “falls short of covering providers’ costs.” They cite a national MedPac study stating that hospitals averaged a negative 12.7% margin on Medicare services in 2022—a record low likely due to rising inflation.
First, while reimbursement may be low on average, Medicare is designed to match the break-even costs and it does in many cases. The graph below from a WI Alliance presentation this month shows data, also from 2022, of Medicare reimbursement rates compared to break-even points that hospitals reported to CMS. Many hospitals do not have their costs covered by Medicare, but many also profit from their reimbursement.

Regardless of how much hospitals receive from Medicare, the authors of the RAND study make it clear that they are not using Medicare to suggest what costs should be. Medicare is the largest healthcare purchaser in the world, and while not perfect, has empirically based and transparent methods and prices. This makes it a great tool to compare hospital prices across states. Low reimbursement rates might make the costs as a percentage of Medicare seem higher overall, but it would not impact how hospitals or states compare to one another.
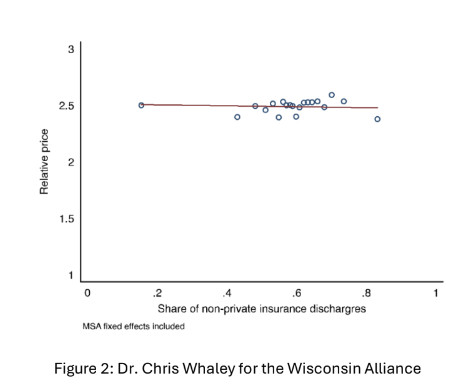
Second, there isn’t much evidence to suggest that low Medicare reimbursement rates are what drive higher commercial prices. The argument is that if Medicare reimbursements are low, then hospitals must shift their costs onto employers to offset their Medicare losses. If this were true, then hospitals with higher numbers of Medicare and Medicaid patients should be more expensive. This is not the case. In the graph below, the relative price stays about the same as the share of non-private insurance discharges increase.

In Wisconsin, data from the National Academy for State Health Policy shows that Wisconsin’s commercial breakeven rate is 153% of Medicare. It is expected that the actual costs are higher to make a profit, but Wisconsin is 318% of Medicare which is significantly higher and not as easily explained by cost-sharing.
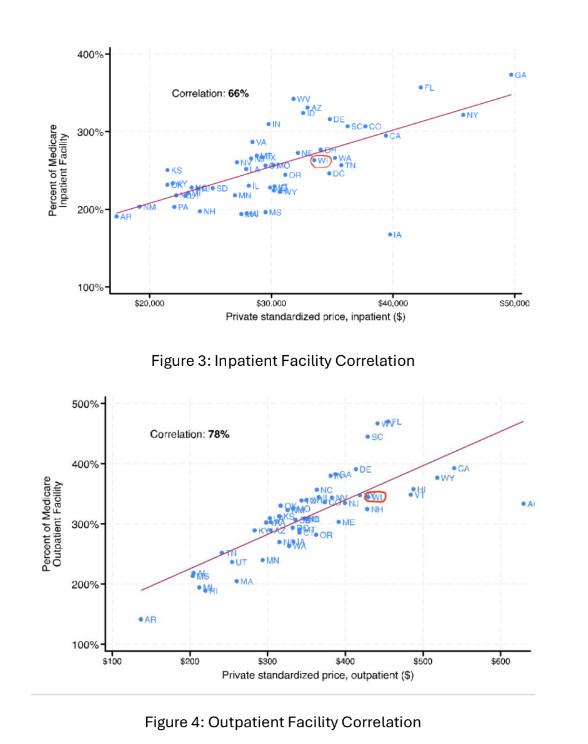
Also critical, the RAND study has two different ways to examine prices—the Medicare percentage rate and a standardized price. The standardized price adjusts for differences in procedures and population to calculate a dollar amount. The graphs below plot states by the percent of Medicare on the Y axis, and standardized price on the X axis. For both inpatient and outpatient facilities, there is a strong positive correlation meaning that both measures rise at similar rates. This suggests that no matter which measure is used, the study results would be the same.

The criticisms of the RAND study do not stand up to even the most cursory level of scrutiny. RAND prides itself on objectivity and has been regularly rated among the “least biased” sources of research. As we again debate healthcare price transparency in Wisconsin, it is vital that policymakers are armed with objective facts about hospital pricing and aren’t swayed by critiques from those with a clear economic interest in the debate.